First Automated Software
for
Quantitative Liver Function

HEPATIQ SOFTWARE

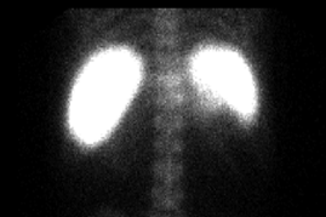
The HEPATIQ® software uses nuclear medicine images from a SPECT scanner using the QLSS® protocol.  The patient is injected with the standard Technician-99 sulfur colloid radioisotope and planar and SPECT images acquired.  The sulfur colloid solution is mostly taken up by the liver.  The amounts not taken up by the liver end up in the spleen and bone marrow.  As the radioisotope decays, it emits photons that can be picked up by a nuclear medicine camera.
The image will be bright where the radioisotope collects – the liver, spleen and bone marrow.   A decrease in the number of functioning lobules or blood flow to them would reduce the brightness of the liver area and increase the brightness of the spleen and bone marrow areas.  Analyzing the brightness distribution between the three regions allows a calculation of liver function. 

The images are analyzed to compute the PHM® liver function index, fLV® liver volume index, fSV® spleen volume index, HAI™ activity index, eFS™ fibrosis score, and eEV™ variceal size.  These indices help diagnose and stage chronic liver disease.  A one-page HEPATIQ report is prepared which shows serial and differential graphs for clinical use.

The HEPATIQ software interfaces with the radiology department PACS and the hospital Electronic Health Records systems.   For a webinar on the clinical applications of the HEPATIQ software, please contact sales@hepatiq.com.